Health
Ten graphs that show Victoria’s coronavirus trends – The Age
These charts and maps show how Victoria’s increase in coronavirus cases during June/July compares with the first peak in March/April.

Note: These charts are all updated once per day, typically about 4pm in the afternoon when the Victorian health department releases the detailed daily figures.
The increase in case numbers
This gra…

Continue Reading
-

 Noosa News13 hours ago
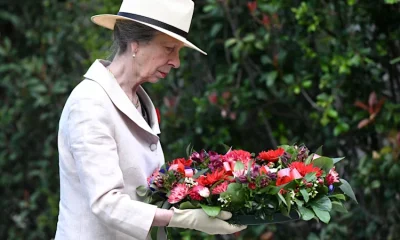
Princess Anne visits Gallipoli Barracks in Brisbane on Remembrance Day as Australian tour ends
-

 General10 hours ago
Car bomb outside Islamabad court kills at least five, Pakistani media says
-

 Noosa News12 hours ago
Royal visit to Gallipoli Barracks in Enoggera on Remembrance Day
-

 General14 hours ago
‘Do you care?’: Coles stares down anti-salmon activists
